Demand Forecasting
Demand Forecasting predicts how much of a product you are likely to sell over the next days or weeks. It is based on your past sales figures from the last 180 days. This lets you spot early which products might run low before stock actually runs out.
What can I do here?
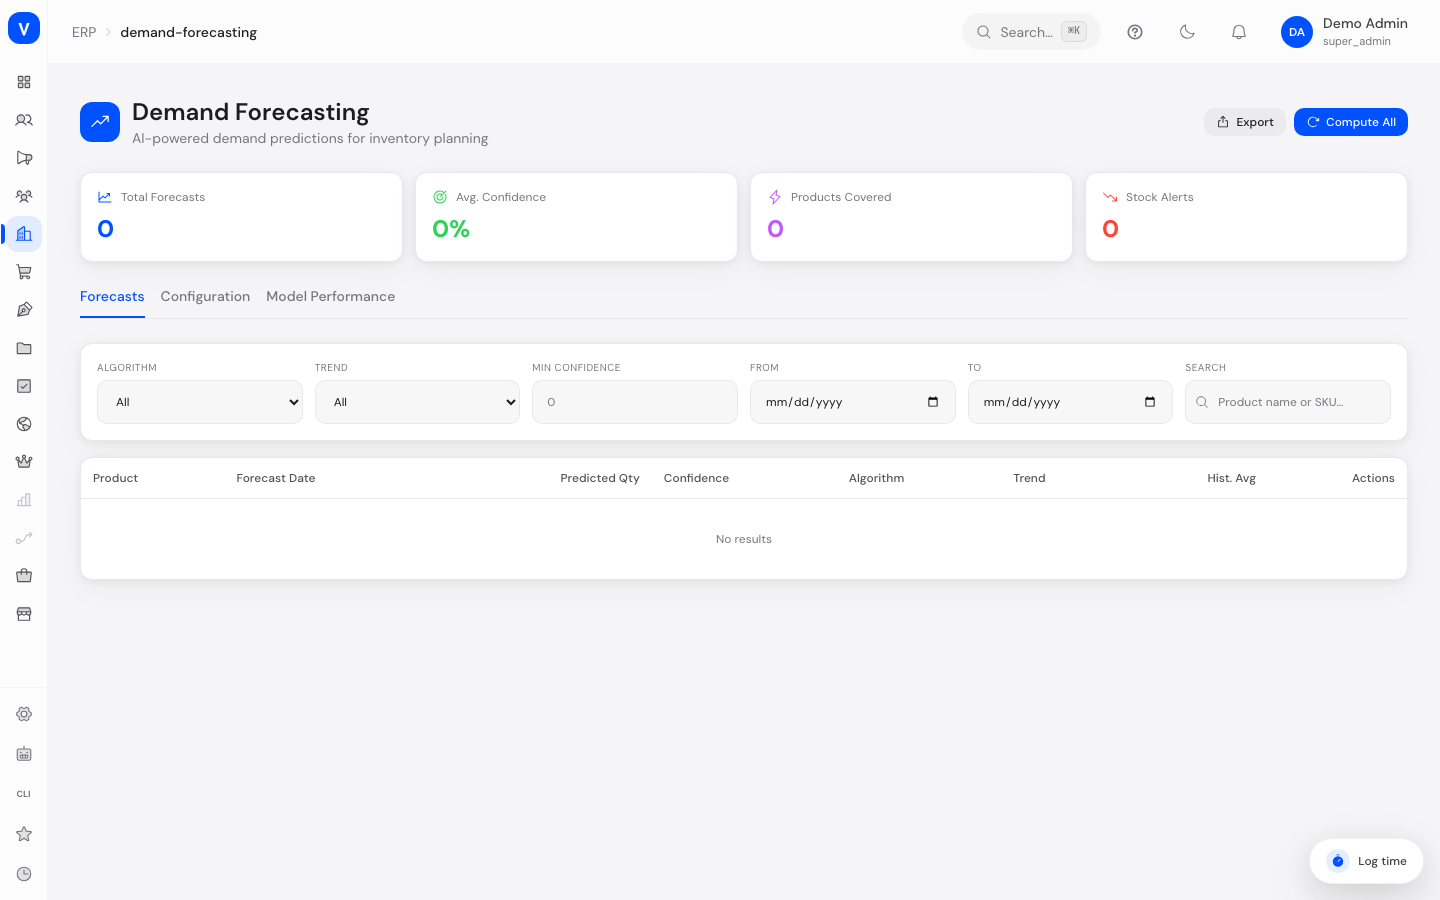
- Get an overview of all computed forecasts (total count, average reliability, products covered, stock alerts)
- Recompute forecasts for individual products or for all products at once
- Filter and search forecasts by algorithm, trend, minimum confidence, date range, or product name/SKU
- Manually override the predicted quantity of a single forecast if you have extra knowledge (e.g. an upcoming promotion)
- View the full forecast history for a product and recompute from there
- Configure forecasting settings (enable/disable, algorithm, minimum historical days, automatic recompute interval, seasonal analysis, trend detection, confidence threshold, low-stock alert threshold)
- Check model accuracy on the Performance tab (predicted vs. actual comparison)
- Export all forecasts to a file
- Clean up (delete) old forecasts
Step by step
- Compute forecasts for all products: Click "Compute All" in the top right. The system automatically finds every product with enough sales history and computes a fresh forecast for each one.
- View and recompute a single forecast: Click a row in the table to open the product's detail view. There you can see the forecast history as a bar chart and trigger a fresh computation via "Recompute".
- Manually adjust a forecast quantity: Click "Adjust" on a table row, enter the desired quantity, and save. The forecast is then marked as manually adjusted.
- Change configuration: Switch to the "Configuration" tab, adjust the desired values, and click "Save".
Fields explained
| Field | Meaning | Notes/Effect |
|---|---|---|
| Product | Product name and SKU | — |
| Forecast Date | Date the forecast applies to | Derived from the chosen forecast horizon |
| Predicted Qty | Predicted sales quantity for the whole forecast period | Can be manually overridden via "Adjust" |
| Confidence | How reliable the system considers the forecast (0–100%) | Based on data volume and variance of past sales; higher is better |
| Algorithm | Calculation method used | See "Values & Status" below |
| Trend | Detected direction of demand | Up/Down/Stable/Volatile |
| Hist. Avg | Average historical daily sales | Reference value to put the forecast in context |
| Forecasting Enabled | Whether automatic forecast computation runs at all | Configuration |
| Min Historical Days | Minimum days of sales data required before a product is computed | Products with less history are skipped |
| Recompute Interval (h) | How often the forecast is automatically recomputed (in hours) | Configuration |
| Seasonal Analysis | Whether recurring patterns (e.g. weekdays) are taken into account | Configuration |
| Trend Detection | Whether rising/falling trends are detected | Configuration |
| Confidence Threshold | Reliability level above which a forecast counts as "reliable" | Configuration |
| Low Stock Alert Days | Remaining days of stock below which an alert is triggered | Configuration |
Values & statuses
Algorithm
| Value | Plain-language meaning | What happens |
|---|---|---|
| Simple Moving Average | Average of recent sales days, all days weighted equally | Simple, robust estimate |
| Weighted Moving Average | Same as above, but more recent days count more | Reacts faster to recent changes |
| Exponential Smoothing | Recent sales are weighted more heavily than older ones | Good balance of stability and recency; default setting |
| Linear Regression | Fits a trend line through past sales figures | Explicitly accounts for upward/downward trends |
Trend
| Value | Plain-language meaning | What happens |
|---|---|---|
| Up | Recent sales are clearly above the older average | Shown with an up arrow in the list |
| Down | Recent sales are clearly below the older average | Shown with a down arrow |
| Stable | No clear change detected | — |
| Volatile | Sales fluctuate strongly and irregularly | Treat the forecast with caution |
Frequently asked questions
Why is no forecast computed for a product?
This product probably doesn't have enough sales days yet (at least 7 days with sales within the last 180 days, configurable via "Min Historical Days"). Products without sufficient history are automatically skipped by "Compute All".
What does low confidence mean?
Low confidence means there is either little sales history or past sales fluctuate a lot. Treat such forecasts with caution and adjust manually if needed.
What happens when I manually adjust the forecast quantity?
Your entered quantity is saved and marked as manually adjusted. It overrides the automatically computed quantity until a new computation runs.
What is the stock alert for?
It shows that, according to the forecast, a product's current stock could run out in fewer days than configured (default: 14 days), so you can reorder in time.
What does the "Performance" tab show?
It compares predicted vs. actually sold quantities for past forecasts and shows metrics for model accuracy (average error and hit rate).
Related topics
/erp/demand-forecasting- Product
- Example screw M6
- Algorithm
- Moving average
- Confidence
- 78 %
- Trend
- Trending Up
- Forecast Horizon
- 30 days
| Month | Predicted | Actual | Confidence |
|---|---|---|---|
| 06/2026 | 420 | 398 | 74 % |
| 07/2026 | 460 | 471 | 76 % |
| 08/2026 | 505 | 512 | 78 % |
| 09/2026 | 540 | - | 78 % |
/erp/demand-forecasting