Anomaly Detection
Anomaly Detection monitors key metrics from orders, payments, inventory, revenue, and customers, and raises an alert when a value behaves unusually — for example a sudden drop in daily orders or a strikingly high payment failure rate. You define your own rules for which metric to monitor and at which threshold an alert should fire.
What can I do here?
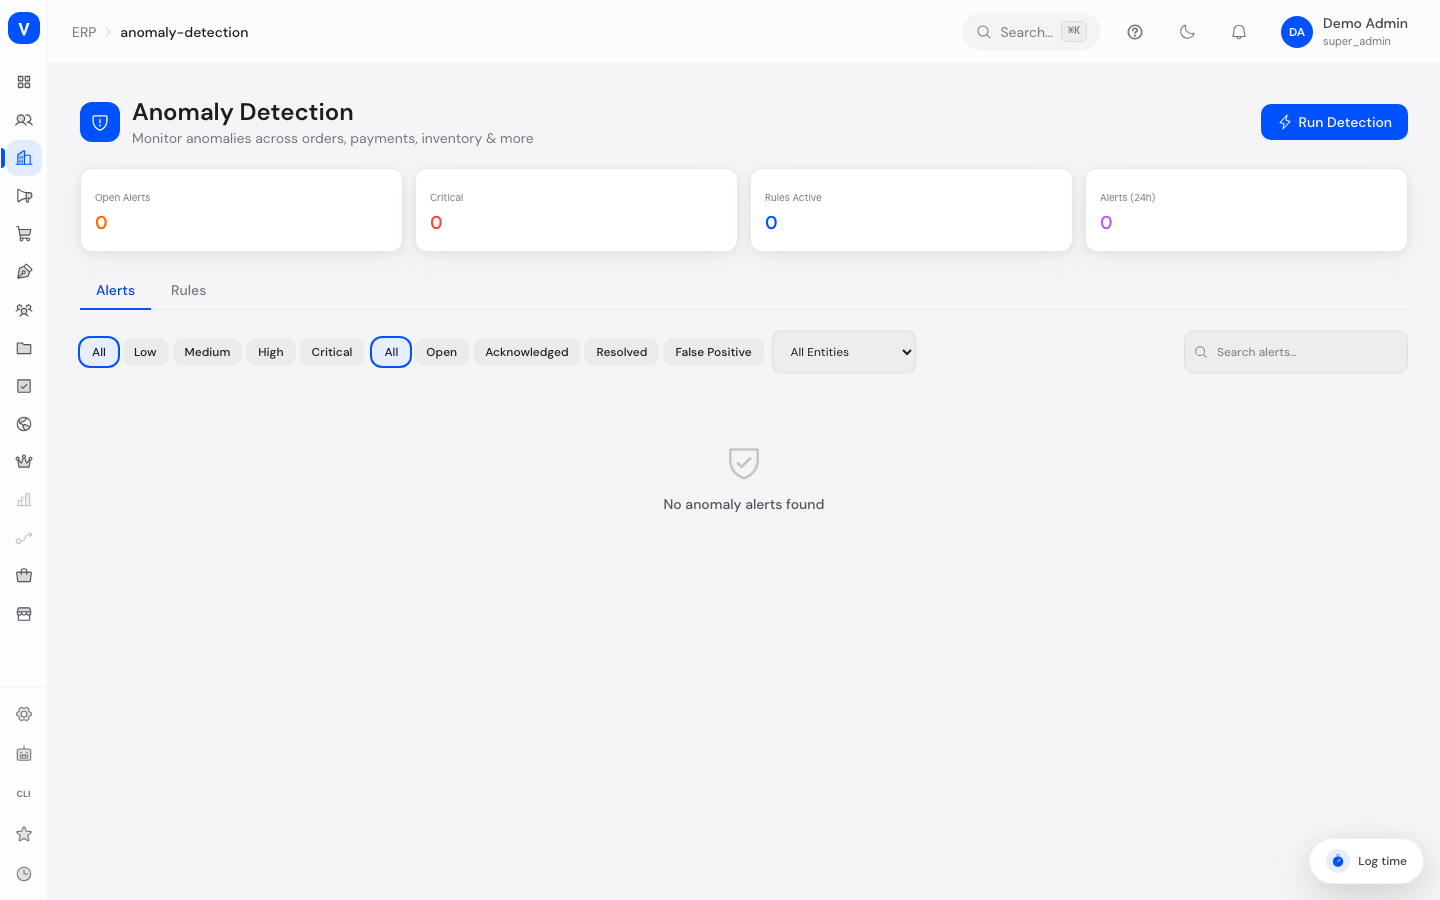
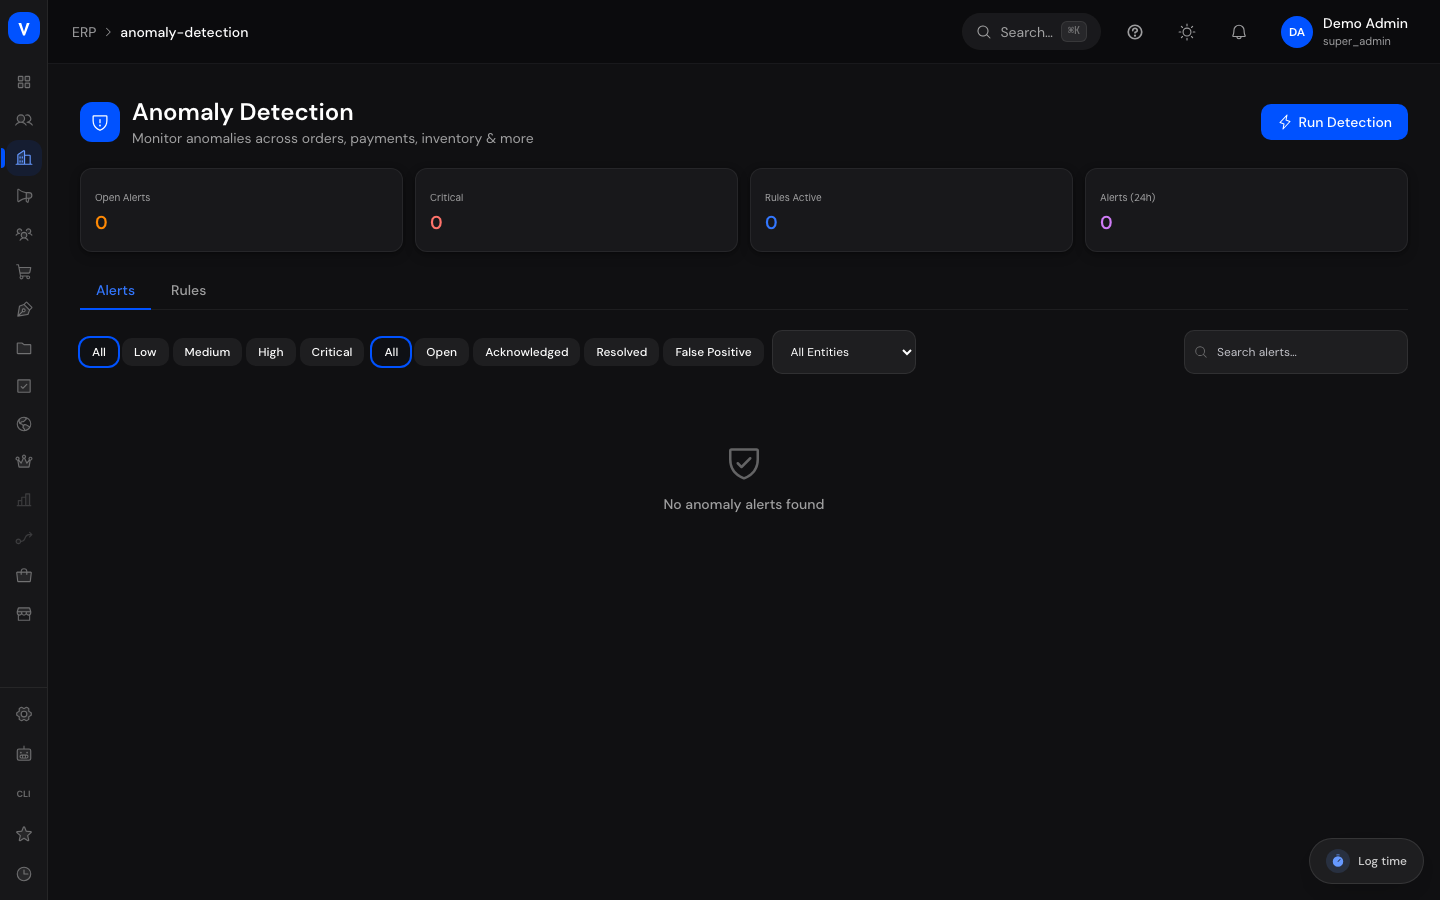
- Get an overview of open alerts, critical alerts, active rules, and alerts from the last 24 hours
- Manually trigger a detection run to check all active rules against the current data immediately
- Filter alerts by severity, status, affected entity, or search term
- Open a single alert for detail view (expected vs. actual value, deviation, metric history chart)
- Mark alerts as acknowledged, resolved, or false positive — individually or for several selected alerts at once
- Create, edit, delete, and individually enable/disable detection rules
Step by step
- Run detection manually: Click "Run Detection" in the top right to check all active rules against the current data immediately and generate new alerts.
- Process an alert: On the "Alerts" tab, open a row to see the detail view with a history chart. Use the icons in the table row to acknowledge, resolve, or mark the alert as a false positive.
- Process multiple alerts at once: Check the boxes for several open/acknowledged alerts and use the action bar to acknowledge, resolve, or mark them all as false positives together.
- Create a new rule: Switch to the "Rules" tab, click "Create Rule", choose the entity and metric to monitor, set the condition (operator + threshold), lookback period, minimum number of data points, and severity, then save.
- Enable/disable a rule: Click the toggle in the "Enabled" column of the rules table to switch a rule on or off without deleting it.
Fields explained
| Field | Meaning | Notes/Effect |
|---|---|---|
| Detected At | Time the alert was triggered | — |
| Entity | Affected data area (e.g. order, payment, inventory) | See "Values & Status" below |
| Metric | Name of the monitored metric within the entity | Freely defined name in the rule, e.g. "daily_count" |
| Expected | Value the system would have expected based on history | — |
| Actual | Actually measured value | — |
| Deviation | Percentage deviation between expected and actual value | Positive = higher than expected, negative = lower than expected |
| Severity | How critical the alert is classified | Set on the rule that triggered the alert |
| Status | Current processing state of the alert | See "Values & Status" below |
| Name (rule) | Name of the detection rule | — |
| Description (rule) | Free text explaining the rule | Optional |
| Entity Type (rule) | Data area the rule monitors | See "Values & Status" below |
| Metric Name (rule) | Name of the metric to monitor | Freely entered |
| Operator (rule) | Comparison type between metric and threshold | e.g. greater than, less than, deviation greater than |
| Threshold (rule) | Limit value at which the rule triggers an alert | — |
| Lookback Days | How many days of history are used to compute the expected value | — |
| Min Data Points | Minimum number of historical data points required before the rule applies at all | Prevents false alarms from too little data |
| Enabled (rule) | Whether the rule is considered during detection | Toggled via the switch |
| Alerts (rule) | Number of alerts this rule has triggered so far | — |
Values & statuses
Entity
| Value | Plain-language meaning |
|---|---|
| Order | Metrics around incoming orders |
| Payment | Metrics around payment transactions |
| Inventory | Metrics around stock levels |
| Revenue | Metrics around revenue and refunds |
| Customer | Metrics around customer activity |
Severity
| Value | Plain-language meaning |
|---|---|
| Low | Minor deviation, usually not critical |
| Medium | Noticeable deviation, should be watched |
| High | Significant deviation, timely review recommended |
| Critical | Severe deviation, should be reviewed immediately |
Status
| Value | Plain-language meaning | What happens |
|---|---|---|
| Open | Alert was detected but not yet processed | Can be acknowledged, resolved, or marked as false positive |
| Acknowledged | Someone has taken note of the alert | Can still be resolved or marked as false positive |
| Resolved | The underlying cause has been fixed | Alert is considered closed |
| False Positive | The alert was classified as not relevant | Alert is considered closed |
Frequently asked questions
How does the system know what an "expected" value is?
The expected value is calculated from the historical development of the metric over the lookback period set on the rule. A rule can only trigger alerts once enough historical data points are available (see "Min Data Points").
Why am I not getting alerts even though a rule is active?
There may not yet be enough historical data points, or the monitored metric hasn't changed enough to cross the configured threshold. Also check whether you've run "Run Detection" already, since rules don't necessarily evaluate in real time.
What's the difference between "Acknowledged" and "Resolved"?
"Acknowledged" only means someone has seen and noted the alert — the underlying cause may still be open. "Resolved" means the underlying issue has actually been fixed.
When should I mark an alert as a false positive?
If it turns out the reported deviation isn't an actual problem (e.g. a planned discount campaign that deliberately changed revenue figures), you can mark the alert as a false positive.
Related topics
/erp/anomaly-detection/erp/anomaly-detection