Support Overview
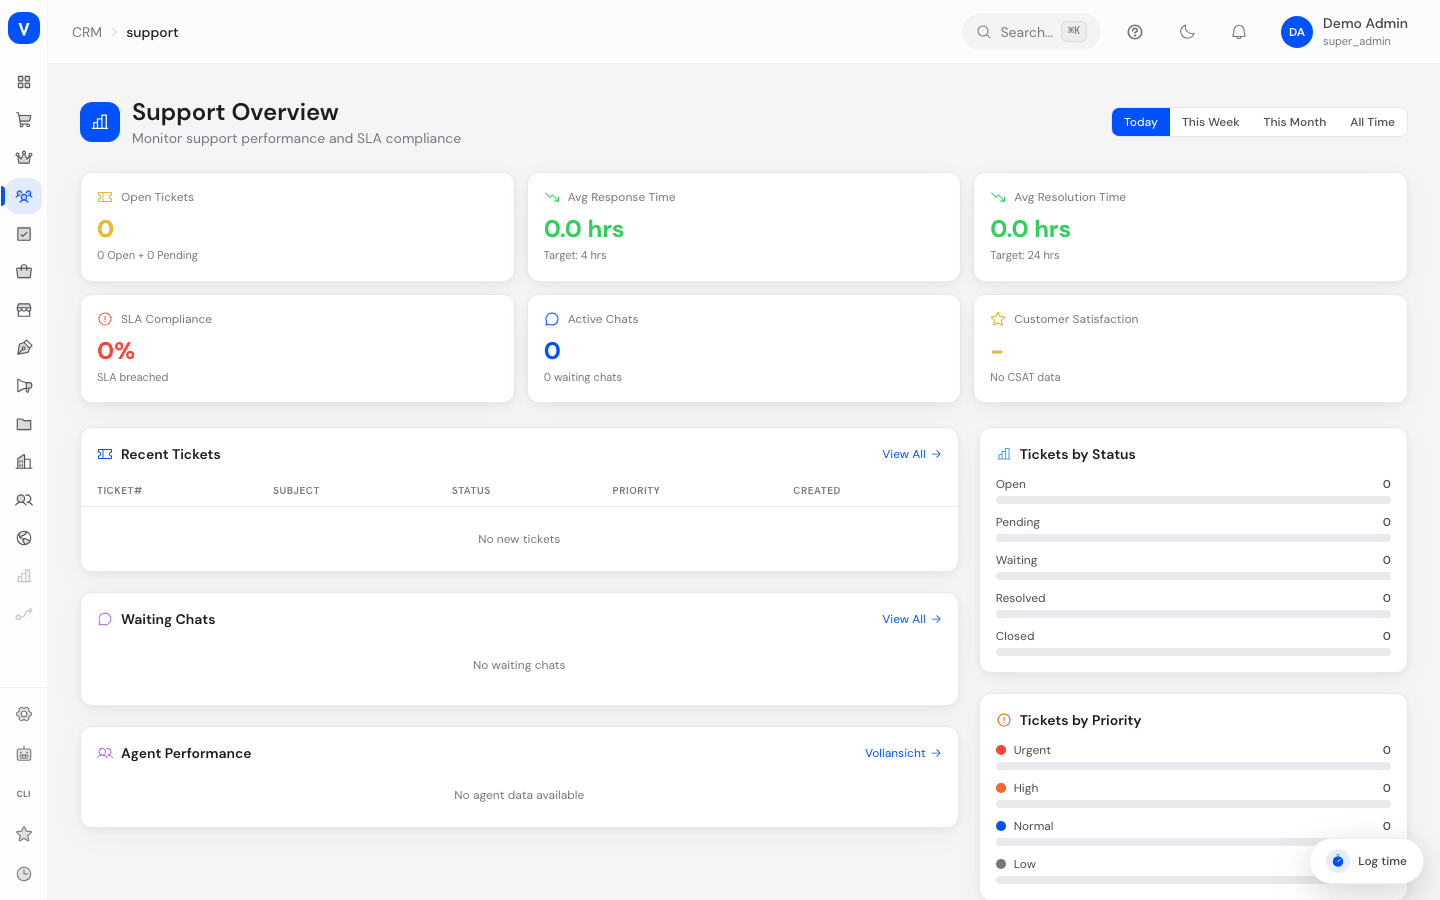
The Support Overview is the cockpit for support leads and team leads: one page with the key numbers on tickets, SLA compliance, live chats, and customer satisfaction, plus quick access to current work. It answers "how is our support doing right now?" without having to click through several separate pages.
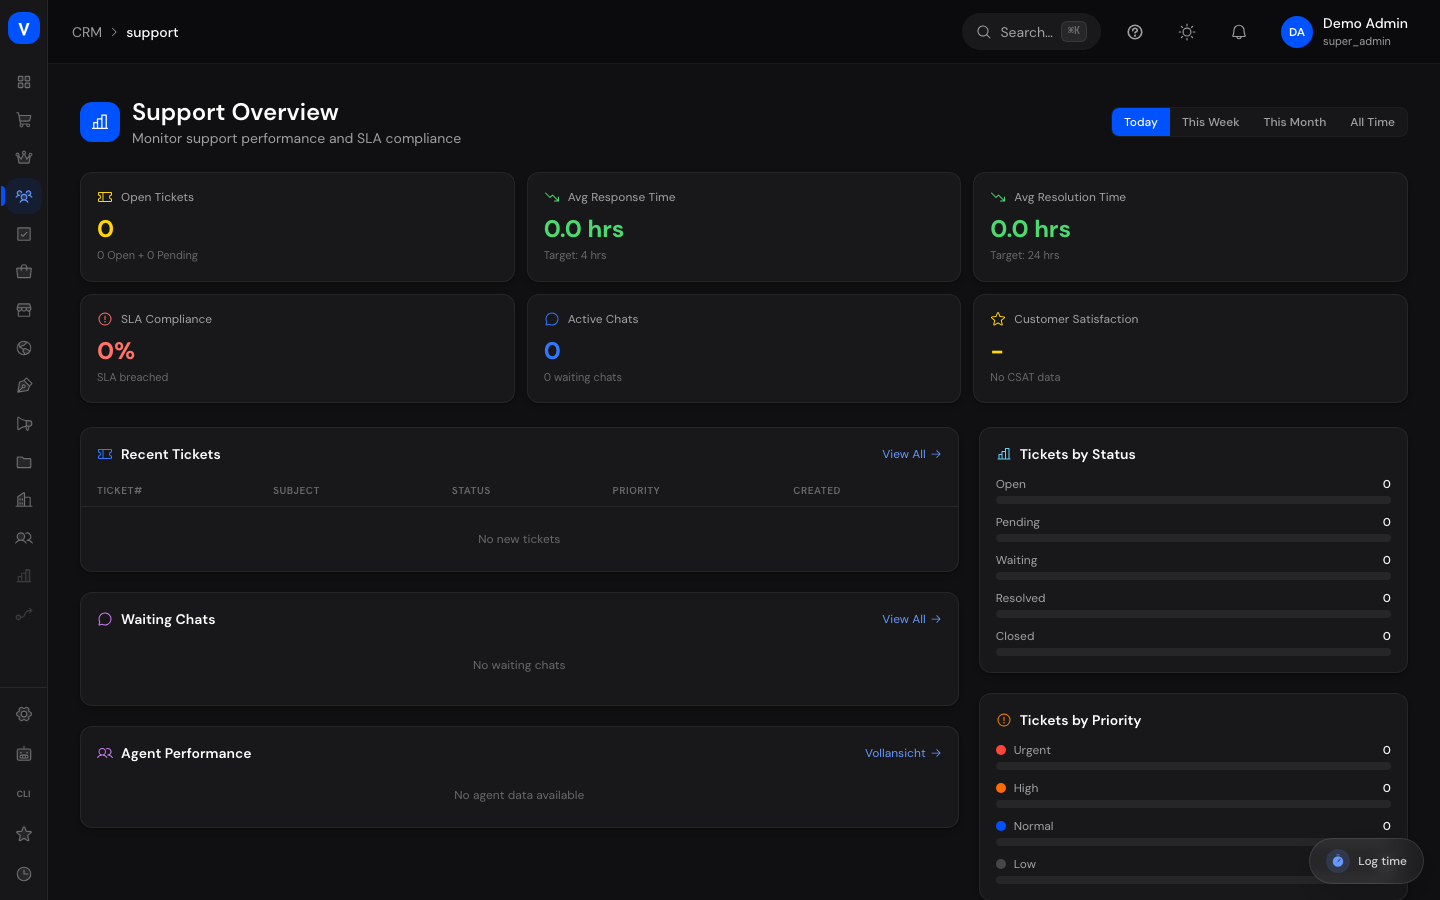
/crm/supportWhat can I do here?
- See open tickets, response time, resolution time, SLA compliance, active chats, and customer satisfaction at a glance
- Switch the time range (Today, Week, Month, All)
- See the newest open tickets and open them with one click
- See waiting live-chat requests and pick them up yourself
- See the breakdown of tickets by status and priority as a bar chart
- Check SLA health (actual vs. target times for first response and resolution)
- Jump to the detailed Support Quality page
Step by step
- Get a daily overview: Open the page → pick the desired range in the top right (e.g. "Today") → the KPI tiles immediately show open tickets, response/resolution time, SLA rate, active chats, and satisfaction for that range.
- Pick up a waiting chat: In the "Waiting Chats" section, click "Pick up" on the request you want — the conversation is immediately assigned to your own account.
- Work an open ticket directly: Click a row in the "Recent Tickets" table to jump straight to that ticket in Support Tickets.
- Spot SLA risk: In the "SLA Health" box, check whether the average first-response or resolution time is above target (highlighted in red) and how many SLA breaches occurred in the period.
/crm/support| Key figure | Value | Status |
|---|---|---|
| First Response Within SLA | 94 % | ✓Within SLA |
| Resolution Within SLA | 81 % | !Within SLA |
| Breached Tickets | 6 | ×SLA breached |
/crm/supportFields explained
| Field | Meaning | Notes/Effect |
|---|---|---|
| Open Tickets | Sum of "Open" and "Pending" status | Shows the current workload |
| Avg Response Time | Average time to first reply | Target 4 hours; green if met, red if exceeded |
| Avg Resolution Time | Average time to resolution | Target 24 hours; green if met, red if exceeded |
| SLA Compliance | Share of tickets within the SLA deadline | Green from 90% and above, red below |
| Active Chats | Number of currently running live-chat sessions | Also shows the number of waiting chats |
| Customer Satisfaction | Average CSAT rating over the last 30 days | Also shows NPS score and number of responses |
| Time Range | Today/Week/Month/All selector | Affects the SLA figures; customer satisfaction is always based on the last 30 days |
Values & statuses
Ticket status breakdown
| Value | Meaning |
|---|---|
| Open | New, unworked tickets |
| Pending | Tickets waiting on a reply (customer or third party) |
| In Progress | Actively worked tickets |
| Resolved | Finished but not yet finally closed tickets |
| Closed | Finally closed tickets |
SLA indicator
| Value | Meaning | What happens |
|---|---|---|
| Green (met) | Actual time is within target | No action needed |
| Red (exceeded) | Actual time is above target | Should be prioritized in team management |
Frequently asked questions
Why do "Agent Performance" and "Top Categories" show no data?
These two tile sections are placeholders in the current version and are not yet connected to data — they deliberately show a hint text instead of numbers.
Why is the "Tickets by Priority" chart always empty?
This breakdown isn't technically wired to the ticket statistics yet and currently shows a constant 0 — a real priority breakdown is planned for a later version.
What's the difference from the "Support Quality" page?
The Support Overview shows the current operational state (tickets, SLA, chats). The linked "Support Quality" page provides deeper trends on CSAT, resolution time, and ticket volume over a selectable period.
Why doesn't customer satisfaction change when I switch the time range at the top?
The time-range switcher only affects the SLA figures. The customer satisfaction tile is always fixed to the last 30 days.
How the metrics are calculated
The tiles are computed live each time the page opens. Important: the time-range switcher (Today/Week/Month/All) only affects the SLA figures; customer satisfaction is always fixed to the last 30 days.
| Metric | Calculation | Colour |
|---|---|---|
| Open tickets | Number of tickets in status "Open" plus "Waiting" | — |
| Ø response time | Average of (time of first reply − ticket creation), only tickets with a recorded first response | green at ≤ 4 hours, otherwise red |
| Ø resolution time | Average of (resolution time − ticket creation), only resolved tickets | green at ≤ 24 hours, otherwise red |
| SLA compliance | Share of tickets without an SLA breach out of all tickets that have an SLA rule, in the selected period | green from 90 %, otherwise red |
| Customer satisfaction | Average CSAT rating of the last 30 days (plus NPS and number of responses) | green from 4.0, otherwise amber |
Whether a ticket breaches the SLA follows from the deadlines set in Support settings (first-response and resolution time). The underlying CSAT values are explained on the Customer satisfaction (CSAT) page.
How to improve the metrics
- Respond quickly first. The Ø response time (target 4 h) and SLA compliance depend directly on the first reaction.
- Resolve finally without delay. Shorter resolution times (target 24 h) lift two tiles at once.
- Reduce SLA breaches. Overdue tickets first — every avoided breach moves the SLA rate toward 90 %.
- Keep the backlog small. Fewer open/waiting tickets lower the first tile and ease the response time.