Support Quality
The Support Quality page shows how well support is actually performing over a selectable time range: how satisfied customers are (CSAT), how fast the team responds and resolves, and how ticket volume is trending. Unlike the Support Overview, which shows the current operational state, this page provides trends and history for a deeper look at quality.
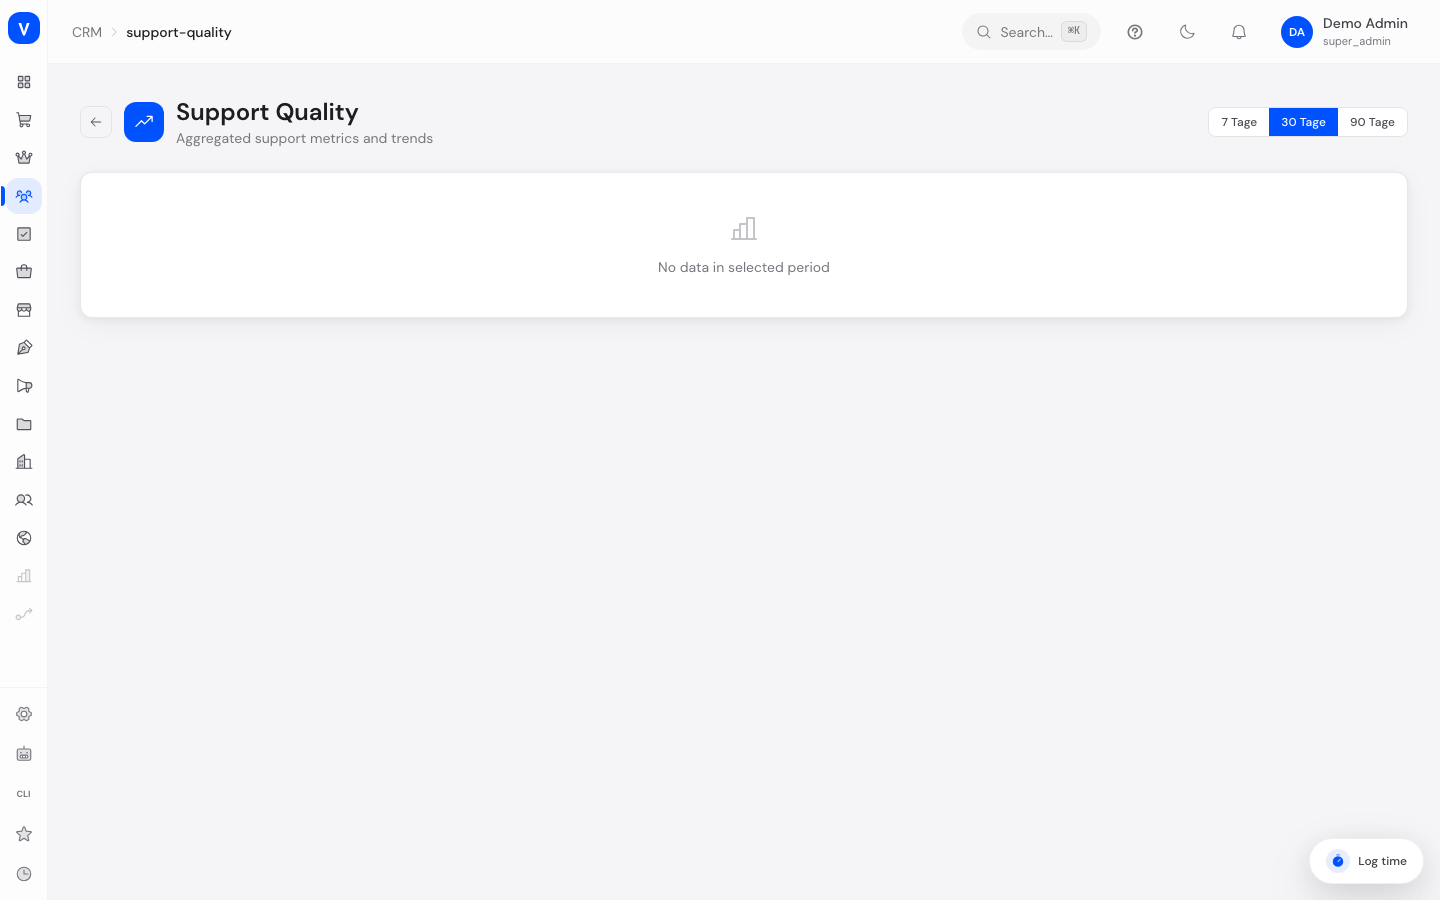
/crm/support-qualityWhat can I do here?
- Choose the reporting period (7, 30, or 90 days)
- See the average customer satisfaction (CSAT) for the period
- See the average resolution time and first-response time
- See the resolution rate (share of resolved/closed tickets)
- Track the CSAT rating history as a chart over the period
- Track the daily ticket volume history as a chart
Step by step
- Choose a time range: Switch between "7 days", "30 days", and "90 days" at the top right — all figures and charts update automatically for the selected period.
- Assess customer satisfaction: In the "CSAT" summary card, check whether the average is above 4 out of 5 (green), between 3 and 4 (amber), or below (red).
- Spot a trend: In the "CSAT Trend" chart, look at the bars per day (hover for exact values) and compare with the "Volume Trend" chart to see whether a rise in ticket volume coincides with a drop in satisfaction.
- Go back to the overview: Use the arrow in the top left to return to the Support Overview.
/crm/support-quality| Calendar week | CSAT Average | ratings |
|---|---|---|
| Week 31 | 4.0 | 28 |
| Week 32 | 4.2 | 31 |
| Week 33 | 4.5 | 34 |
| Week 34 | 4.3 | 35 |
/crm/support-qualityFields explained
| Field | Meaning | Notes/Effect |
|---|---|---|
| CSAT Average | Mean customer satisfaction rating (1–5) for the selected period | Based on ratings customers submit after a ticket is resolved; green from 4, amber from 3, otherwise red |
| Avg Resolution Time | Average time from ticket creation to resolution | Only tickets with a recorded resolution time are included |
| Avg First Response Time | Average time to the first reply | Only tickets with a recorded first response are included |
| Ticket Volume | Total number of tickets created in the period | Also shows how many of those were resolved |
| Resolution Rate | Share of resolved/closed tickets out of total volume | Green from 80%, amber from 60%, otherwise red |
| CSAT Trend | Daily average CSAT values as a bar chart | Bar color indicates the rating band |
| Volume Trend | Daily count of new tickets as a bar chart | Helps spot load spikes |
Values & statuses
CSAT color scale
| Value | Meaning |
|---|---|
| Green (≥ 4.0) | Customers are mostly satisfied |
| Amber (3.0–3.9) | Mixed satisfaction, should be watched |
| Red (< 3.0) | Customers mostly dissatisfied, action needed |
Resolution rate indicator
| Value | Meaning |
|---|---|
| Green (≥ 80%) | Very good throughput |
| Amber (60–79%) | Medium throughput |
| Red (< 60%) | Many open/unworked tickets relative to volume |
Frequently asked questions
Is this the same rating as the "Quality Score" in the ticket list?
No. The Quality Score in Support Tickets comes from an AI post-analysis of individual conversations. This page instead shows aggregated CSAT ratings submitted directly by customers, plus time and volume figures over the whole period — two separate, independent measurements.
Why do I see "No data for this period"?
This appears when neither tickets were created nor CSAT ratings were submitted in the selected period — for example with very short periods and little activity.
Where do the CSAT ratings come from?
They are submitted by customers through the satisfaction survey that is automatically sent after a ticket is resolved.
Why does the resolution time here differ from the value on the Support Overview?
The Support Overview shows current, live figures, while this page calculates the same value for a fixed historical period (7/30/90 days) — values can differ slightly between different periods.
How the metrics are calculated
All values relate to the tickets created in the selected period (7, 30 or 90 days) and are computed live on each load. Unlike the agent evaluation, all tickets are included here, not only one agent's.
| Metric | Calculation |
|---|---|
| CSAT average | Average of the customer star ratings (1–5) of the tickets in the period; only rated tickets count |
| Ø resolution time | Average of (resolution time − creation), only resolved tickets |
| Ø first-response time | Average of (first reply − creation), measured in minutes |
| Resolution rate | Number of resolved/closed tickets divided by all tickets in the period, as a percentage |
| CSAT trend | Daily average of the ratings (grouped by rating day) |
| Volume trend | Number of newly created tickets per day |
The colour thresholds (CSAT green ≥ 4, amber ≥ 3; resolution rate green ≥ 80 %, amber ≥ 60 %) are described above under "Values & Status". Where the CSAT ratings come from and how the underlying average is formed is explained on the Customer satisfaction (CSAT) page.
How to improve the quality metrics
- Lower the first-response time. It is measured in minutes and responds fastest to consistent early replies.
- Raise the resolution rate. Actively close tickets instead of leaving them open — every resolved/closed ticket counts toward the numerator.
- Improve CSAT. Follow up on negative ratings and resolve quickly (see Customer satisfaction).
- Plan for load peaks. Use the volume trend to reinforce staffing on high-volume days before satisfaction drops.