Adoption Analytics (HEART Metrics)
SELLERLOGIC Commerce Services gives you an embeddable help package (SDK) that you can add to your own online shop — with it, you build product tours, tooltips, and help guides for your own end customers, similar to providers like Intercom or Pendo. This page shows you how well your end customers are adopting this help offering, summarized using Google's so-called HEART framework.
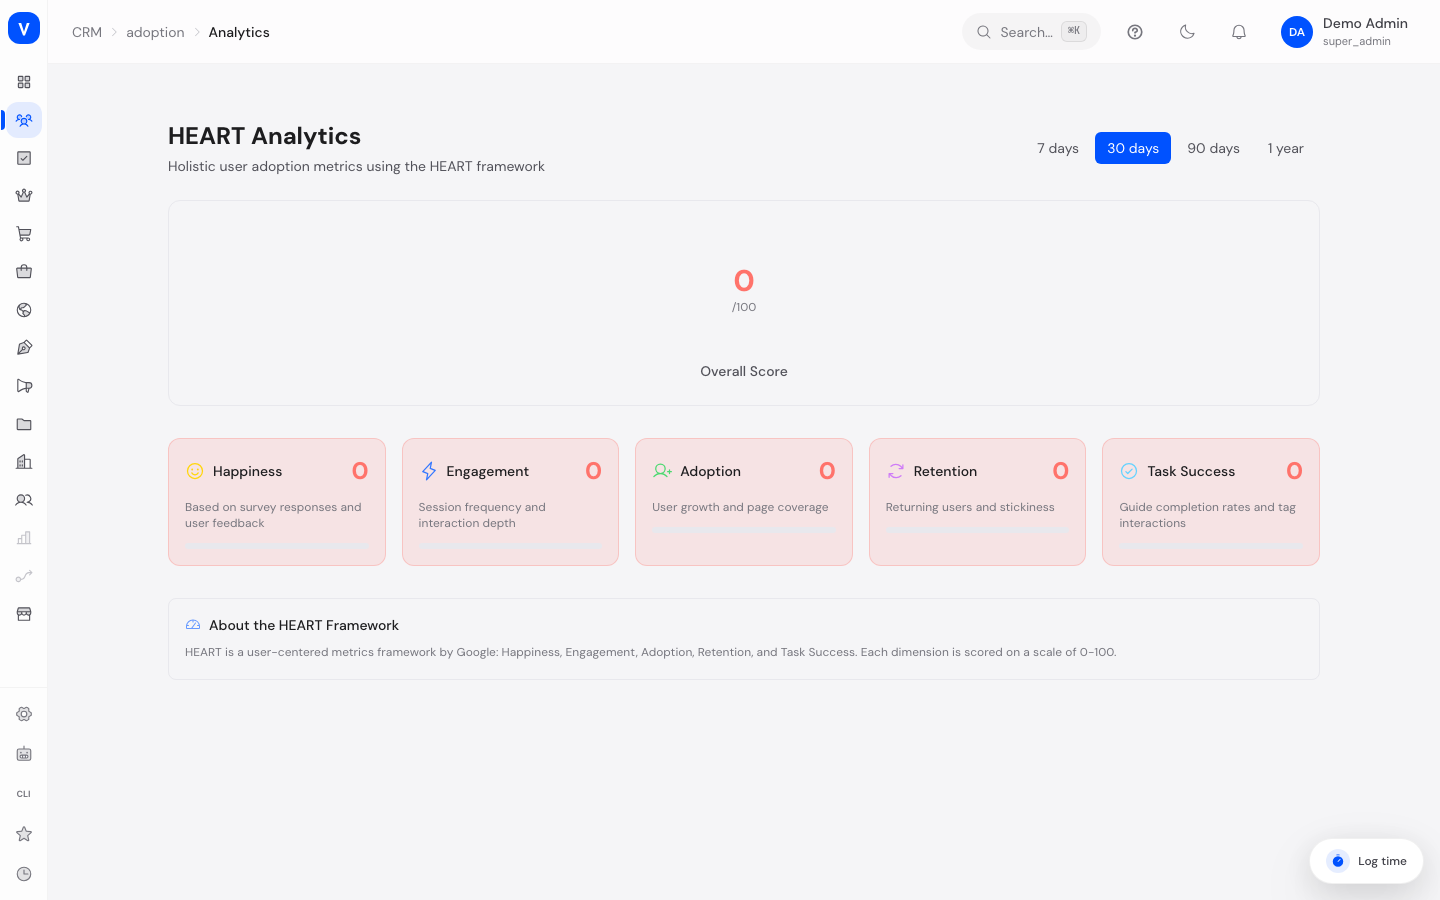
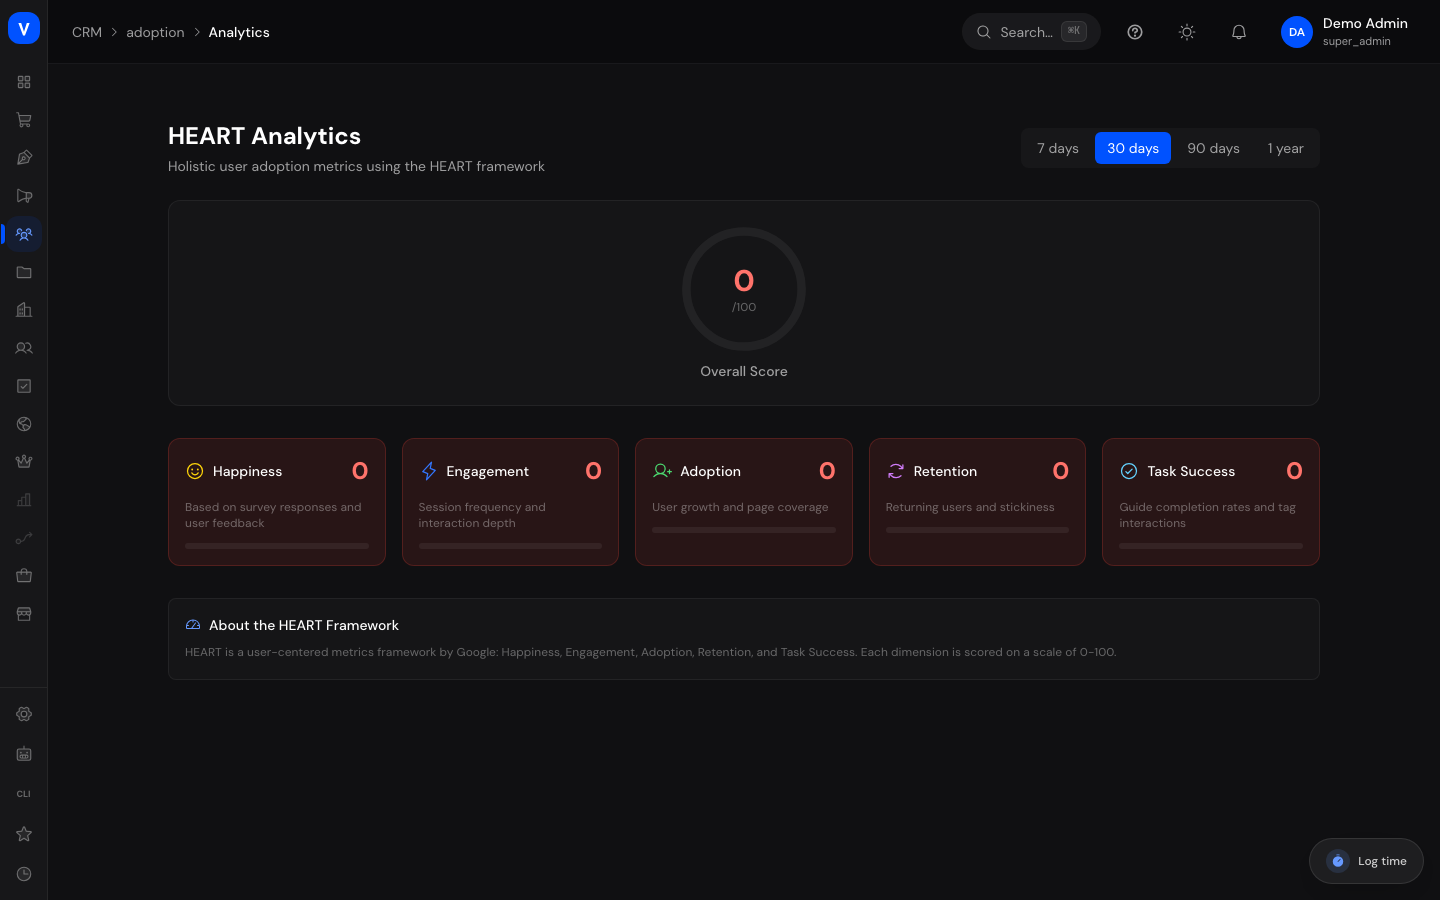
/crm/adoption/analyticsWhat can I do here?
- See an overall score for how well your customers use and adopt the embedded help offering
- Get five sub-areas (Happiness, Engagement, Adoption, Retention, Task Success) scored individually
- Choose the time range you want to look at (7, 30, 90 days, or 1 year)
Step by step
- Open the "Adoption Analytics" page in the CRM area.
- Select the desired time range at the top right (e.g. "30 days").
- Look at the overall score in the middle, and the five individual cards below it.
- Use the color cues (green/yellow/red) to quickly spot where action is needed.
Fields explained
| Field | Meaning | Notes/Impact |
|---|---|---|
| Overall score | Average of all five HEART dimensions (0–100) | Round gauge in the middle of the page |
| Happiness | Score based on survey responses and feedback from your customers | Shows how satisfied customers are with the help offering |
| Engagement | Session frequency and depth of interaction | How often and how intensively customers interact with the widget |
| Adoption | User growth and page coverage | How many customers use the offering at all |
| Retention | Recurring use ("stickiness") | Whether customers use the help offering repeatedly |
| Task Success | Completion rates of guides and interactions | Whether customers successfully complete the offered help steps |
Values & status
Color rating
| Value | Meaning | What happens then |
|---|---|---|
| 70–100 (green) | Good score | No immediate action needed |
| 40–69 (yellow) | Medium score | Keep an eye on it, consider improving content |
| 0–39 (red) | Low score | Action needed — revise content or guides |
Frequently asked questions
What is the HEART framework?
A model developed by Google to measure user adoption along five dimensions: Happiness, Engagement, Adoption, Retention, and Task Success. Each dimension is scored on a scale from 0 to 100.
Whose usage is being measured here — mine or my customers'?
It measures the usage of your end customers, i.e. the people who interact with the embedded help widget in your shop.
Where can I see individual guides or announcements in detail?
Detailed reports on individual guides and announcements can be found on the Content Analytics page.
How the HEART score is calculated
SCS stores one HEART record per day with six values: the overall score and the five dimensions Happiness, Engagement, Adoption, Retention, and Task Success. Each value ranges from 0 to 100 (stored with one decimal place).
- Displayed value = average over the time range. The number on the gauge and on each card is the mean of all daily values in the selected time range (7, 30, 90 days, or 1 year), rounded to a whole number. Example: if the 30-day window contains daily Engagement values of 60, 70, and 80, the card shows 70.
- The overall score is its own daily value that summarizes the five dimensions into one overview — it is averaged over the range in exactly the same way.
- No data = 0. If there are no HEART records in the selected range, every card shows 0 (the page stays error-free).
- When is it updated? The average is recalculated every time you open the page and every time you change the range — there is no cached value you would need to refresh manually.
What the daily dimension values are built from follows the meaning of each dimension (there is no single, fixed published formula):
| Dimension | Mainly draws on |
|---|---|
| Happiness | Feedback from your customers, especially survey responses (NPS/CSAT) |
| Engagement | Frequency of sessions and depth of interaction with the widget |
| Adoption | Growth in user numbers and coverage of the pages where the widget is used |
| Retention | Recurring use ("stickiness") by the same customers |
| Task Success | Completion rates of guides and successfully completed interactions |
How to improve the HEART score
Because the overall score summarizes the five dimensions, you improve it most effectively where the lowest individual card sits. Ordered by impact:
- Task Success first (usually the biggest lever): shorten and sharpen guides with a low completion rate. Per-guide detail is on the Content Analytics page.
- Raise Happiness: publish a short NPS or CSAT survey and act on the feedback — survey responses feed this dimension directly. See Messages & Surveys.
- Increase Adoption: make sure the setup snippet is embedded on all relevant pages, and offer matching guides/tooltips on important pages. See Shop Embedding.
- Encourage Engagement: place tooltips and beacons where customers look for help, so they interact more often and more deeply with the widget.
- Strengthen Retention: keep content current and add new guides and announcements regularly so customers come back.
Impact becomes visible as soon as new daily values fall into the selected range — faster for short ranges (7 days), slower for long ones (1 year), because there many older days are averaged in as well.