Content Analytics (Guides & Announcements)
SELLERLOGIC Commerce Services gives you an embeddable help package (SDK) that lets you provide product tours, guides, and announcements for your own end customers in your shop. This page shows you, in detail, how well individual guides and announcements are performing with your customers.
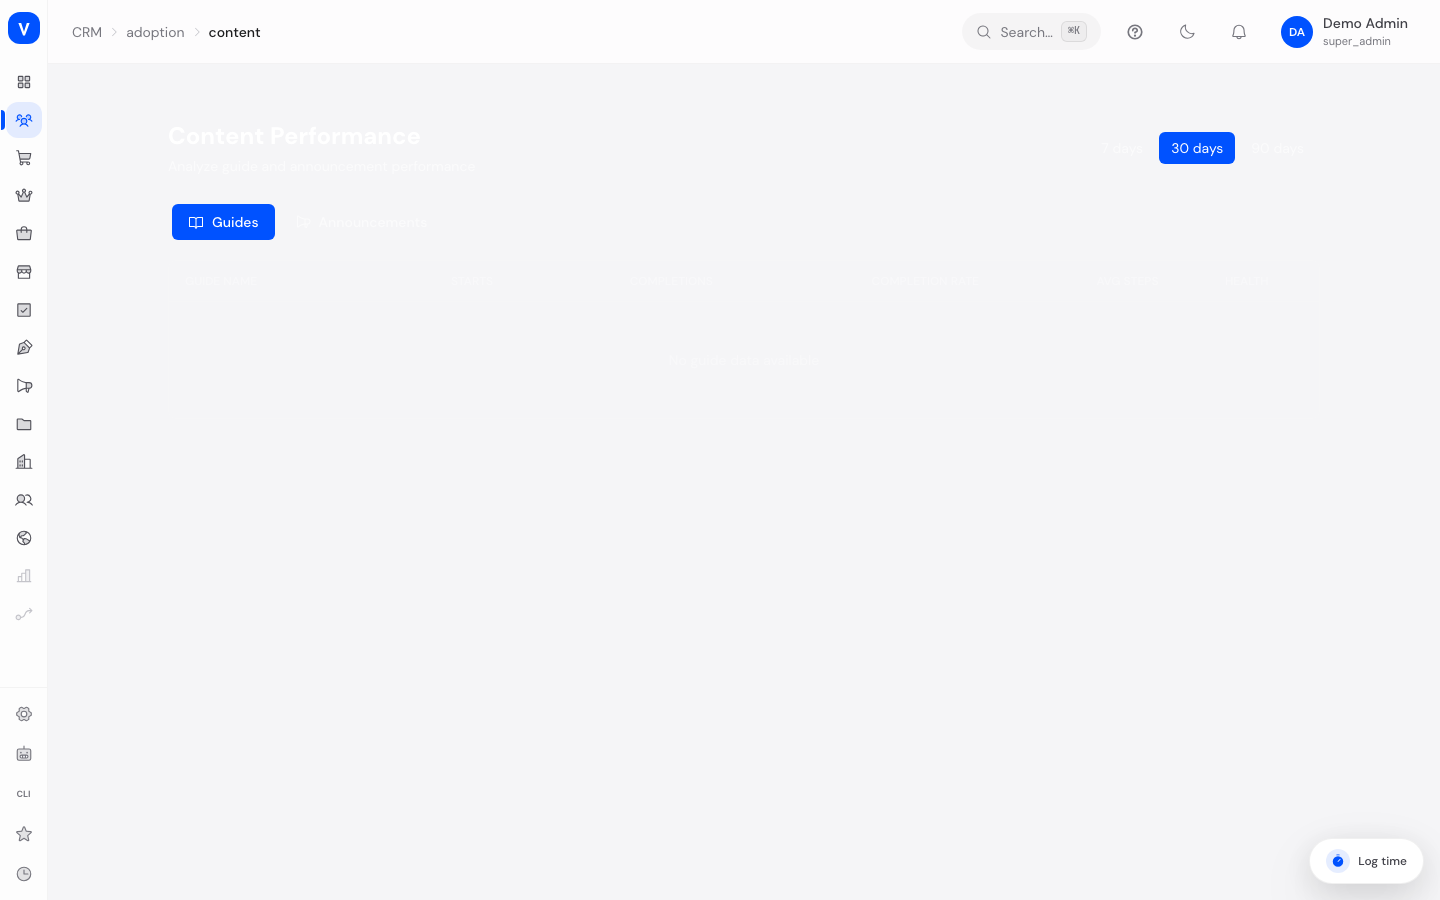
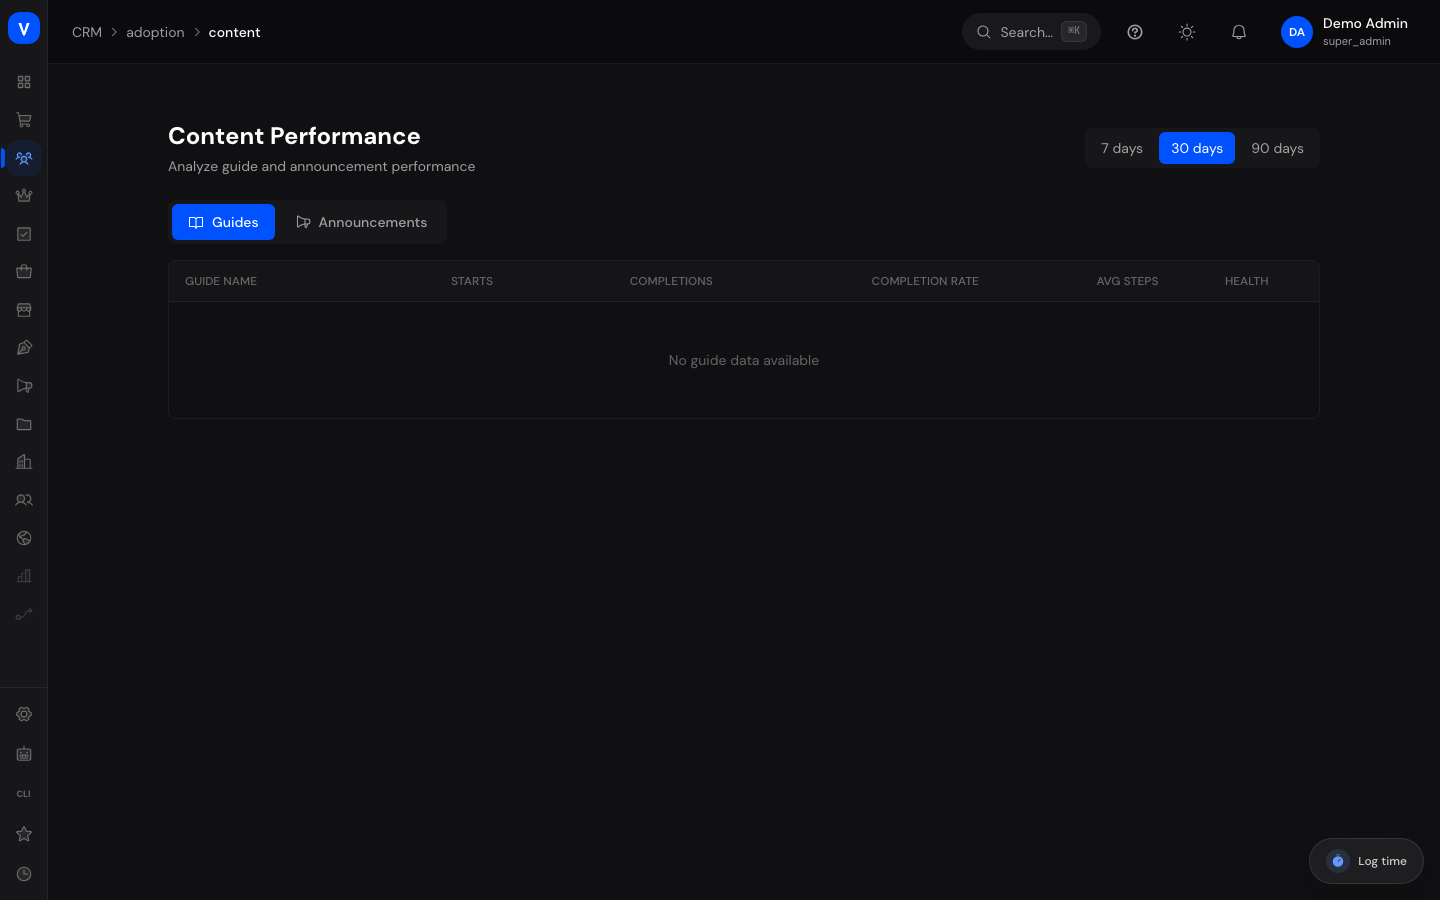
/crm/adoption/contentWhat can I do here?
- See an overview of total events, unique users, guide starts, guide completions, and announcement views
- See, per guide, how often it was started and completed, and its health status
- See, per announcement, how often it was shown, clicked, or dismissed
- Choose the time range you want to look at (7, 30, or 90 days)
Step by step
- Open the "Content Analytics" page in the CRM area.
- Select the desired time range at the top right.
- Look at the overview cards (total events, unique users, guide starts, guide completions, announcement views).
- Switch between the "Guides" and "Announcements" tabs to see the respective detail table; if there are many entries you can page through with "Back"/"Next".
Fields explained
| Field | Meaning | Notes/Impact |
|---|---|---|
| Total events | Number of all recorded usage events in the time range | Covers all interactions with the help widget |
| Unique users | Number of distinct customers who interacted with the widget | Counts each customer only once |
| Guide starts | How often guides were started | — |
| Guide completions | How often guides were completed to the end | — |
| Announcement views | How often announcements were shown | — |
| Guide name | Name of the guide in the table | — |
| Starts / Completions | Number of starts, or completed runs, of the guide | — |
| Completion rate | Share of starts that were also completed | Low values indicate room for improvement |
| Avg. steps | Average number of steps viewed per run | — |
| Health | Traffic-light rating of the guide (see below) | Helps you quickly spot guides with issues |
| Title (announcement) | Name of the announcement | — |
| Views / Clicks | How often the announcement was shown, or clicked | — |
| Click rate | Share of views that resulted in a click | — |
| Dismiss rate | Share of views where customers dismissed the announcement | High values may indicate an annoying or ill-fitting announcement |
Values & status
Guide health
| Value | Meaning | What happens then |
|---|---|---|
| Healthy | The guide is performing well | No action needed |
| Needs attention | The guide is showing early signs of weakness | Monitor the guide, adjust if needed |
| Critical | The guide is barely completed or performing poorly | Revise the guide urgently |
Frequently asked questions
What does "completion rate" mean?
It shows what percentage of customers who started a guide also completed it to the end. A low completion rate can mean the guide is too long or unclear.
How do I spot an announcement that's annoying rather than helpful?
A high dismiss rate combined with a low click rate is a sign that the announcement should be revised or shown less often.
Where do I create new guides or announcements?
Guides are managed on the Guides page, announcements in the Messages area.
How completion rate, health, and the announcement rates are calculated
Every metric on this page is calculated directly from the recorded usage events each time you open the page — for exactly the selected time range (7, 30, or 90 days). There is no cached value.
Per guide
- Starts = number of "guide started" events, Completions = number of "guide completed" events in the range.
- Completion rate = completions ÷ starts, as a whole percentage (0–100). With no starts the rate is 0%. Example: 30 completions on 50 starts = 60%.
- Avg. steps = the average of the viewed step numbers across all "step viewed" events, rounded to a whole number.
Guide health (traffic light) — derived solely from the completion rate:
| Completion rate | Health |
|---|---|
| 60% and above | Healthy |
| 30% to 59% | Needs attention |
| below 30% | Critical |
Per announcement
- Click rate = clicks ÷ views, as a whole percentage. With no views, 0%.
- Dismiss rate = dismissals ÷ views, as a whole percentage. With no views, 0%.
The overview cards at the top (total events, unique users, guide starts, guide completions, announcement views) are simple counts of the respective events in the range; unique users count each customer only once.
How to improve completion rate and guide health
Health depends only on the completion rate — so raise the rate and the traffic light improves. Ordered by impact:
- Shorten the guide: fewer steps mean fewer drop-offs. Compare "Avg. steps" with the total number of steps — if customers stop early, the guide is too long or unclear.
- Show value early: put the most important step first, so customers don't dismiss the guide right at the start.
- Right audience: show the guide only to matching customers and on matching pages via Segments — then it is mainly started by customers it is relevant for.
- Keep target elements stable: if steps point at nothing, customers drop off. Check the Element Detection Rules.
For announcements: a high dismiss rate combined with a low click rate is the signal to revise the announcement, target it more precisely, or show it less often.