Analytics (Marketplace)
This page shows how your marketplace develops over time: revenue, commissions, orders, and the performance of individual categories and vendors compared to each other.
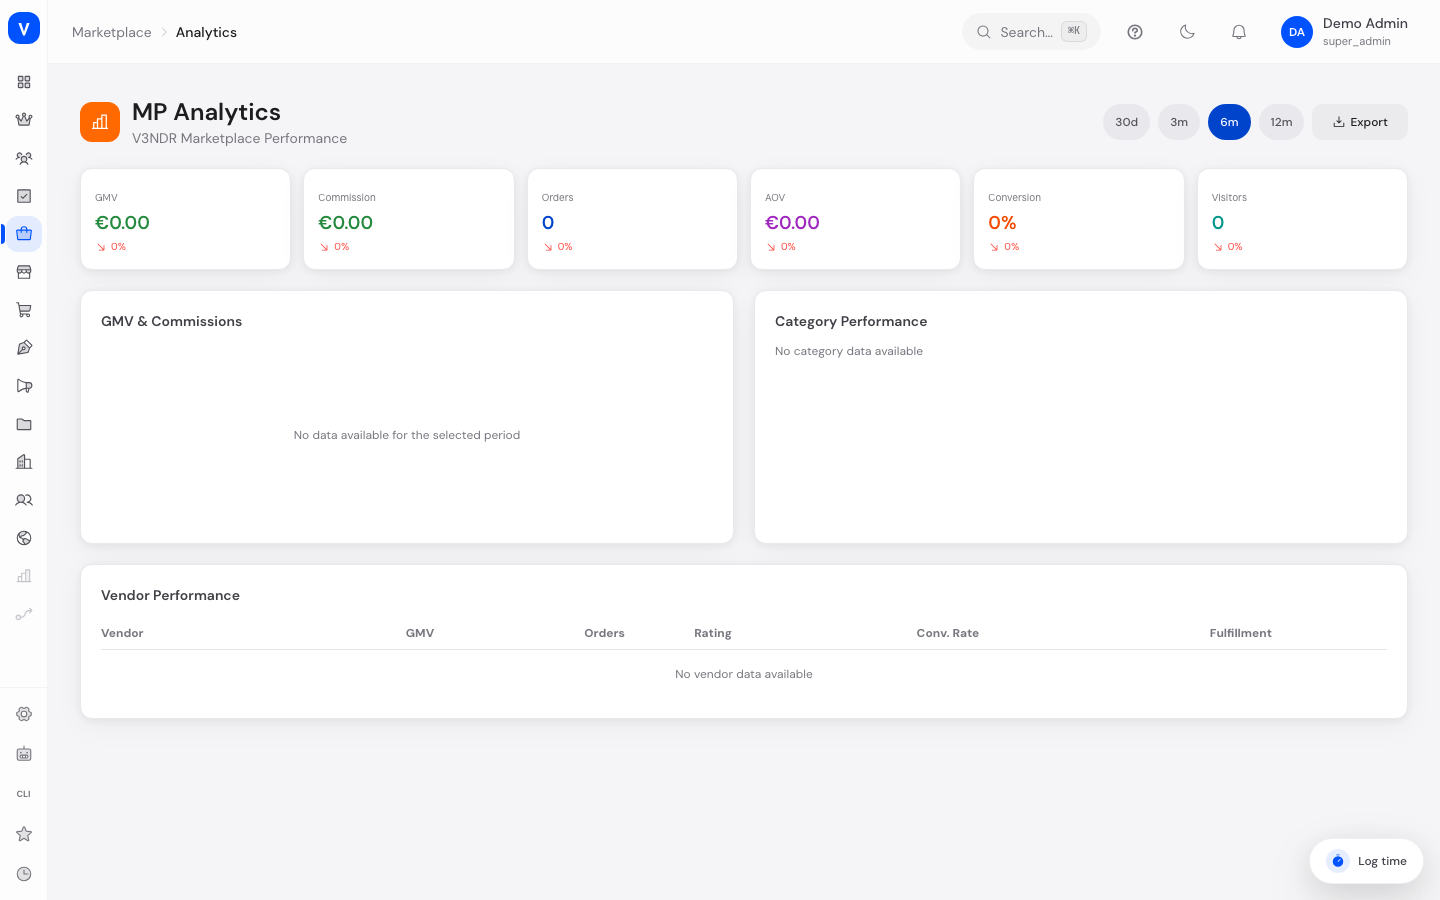
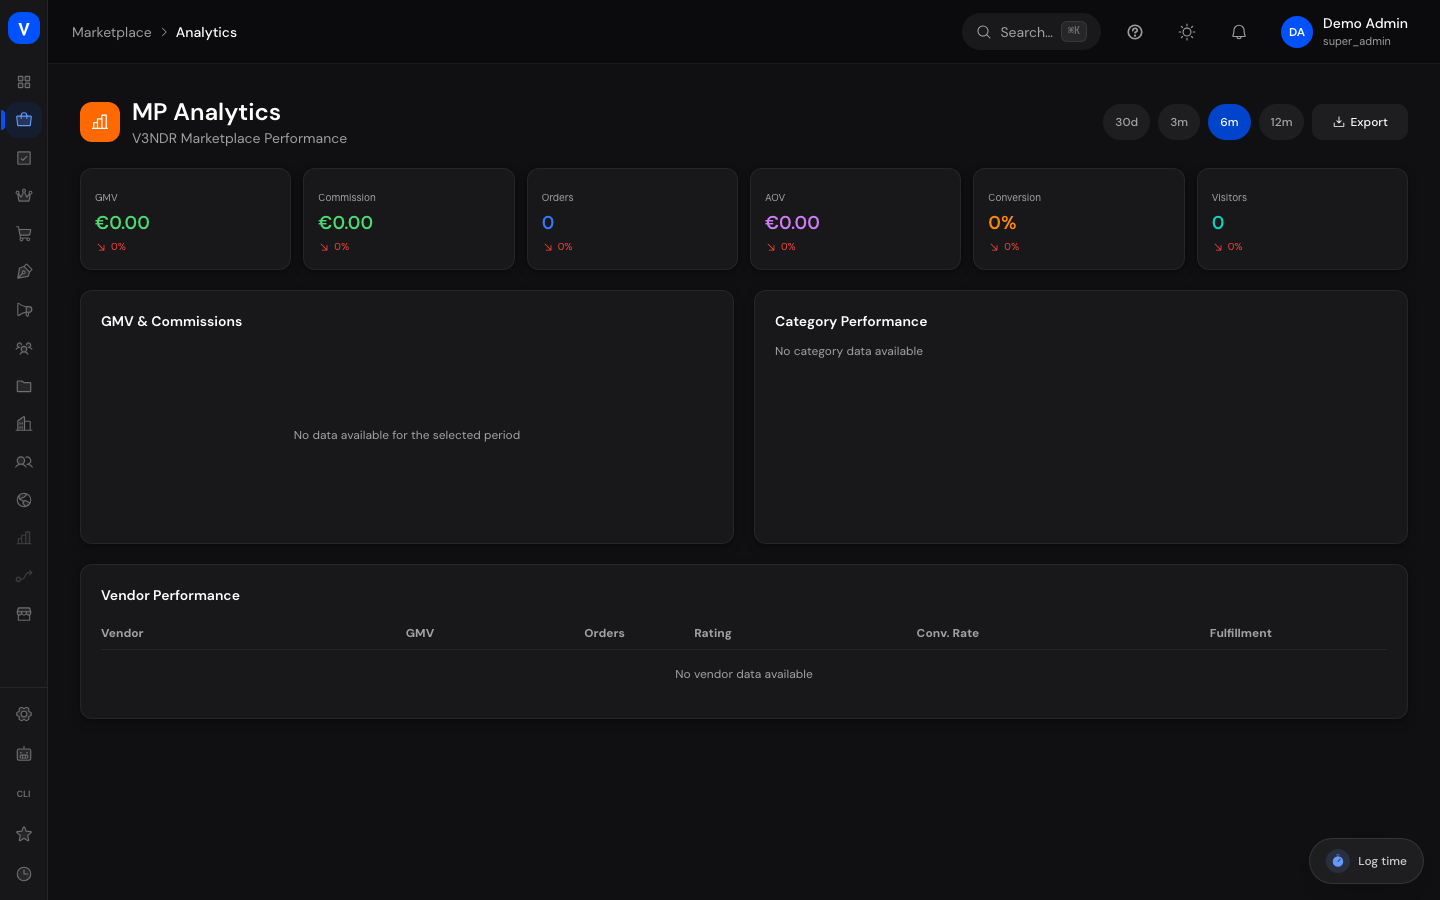
/marketplace/analyticsWhat can I do here?
- View metrics for GMV, commission, orders, average order value, conversion, and visitors
- Choose the time period (30 days, 3, 6, or 12 months)
- View the monthly development of GMV and commissions as a chart
- Compare the performance of individual categories
- Compare the performance of individual vendors
- Export the analysis
Step by step
Check development over a period
- Open "Analytics" in the Marketplace menu.
- Select the desired period at the top.
- Review the KPI tiles (GMV, Commission, Orders, AOV, Conversion, Visitors) and the "GMV & Commissions" chart.
Compare categories or vendors
- Scroll to "Category Performance" or "Vendor Performance."
- Compare GMV, orders, share of total revenue, and growth per category, or GMV, orders, rating, conversion, and fulfillment per vendor.
Export the analysis
- Click "Export" at the top right to download the current data.
Fields explained
| Field | Meaning | Notes/Effect |
|---|---|---|
| GMV | Gross merchandise volume for the selected period | — |
| Commission | Commission revenue for the selected period | — |
| Orders | Number of orders | — |
| AOV | Average order value | — |
| Conversion | Share of visitors who complete an order | — |
| Visitors | Number of unique visitors in the period | — |
| Category Performance | GMV, orders, percentage share, and growth per category | Shows top categories by revenue |
| Vendor Performance | GMV, orders, rating, conversion, and fulfillment per vendor | Shows top vendors by revenue |
Frequently asked questions
Why do the GMV figures here differ from those on the Marketplace dashboard?
Both draw on the same order data but can differ depending on the selected period (dashboard: 7/30/90 days; analytics: 30 days to 12 months).
What does "growth" mean in Category Performance?
It shows the change in a category's revenue compared to the previous period.
Can I view analytics for individual vendors separately?
This page shows a ranking of top vendors by revenue; detailed figures for a single vendor are found on the "Vendors" page.