Marketing Dashboard
The Marketing Dashboard is your central overview of all marketing activity in SELLERLOGIC Commerce Services. At a glance you can see how much revenue your campaigns generate, how much you spend, and which channels perform best.
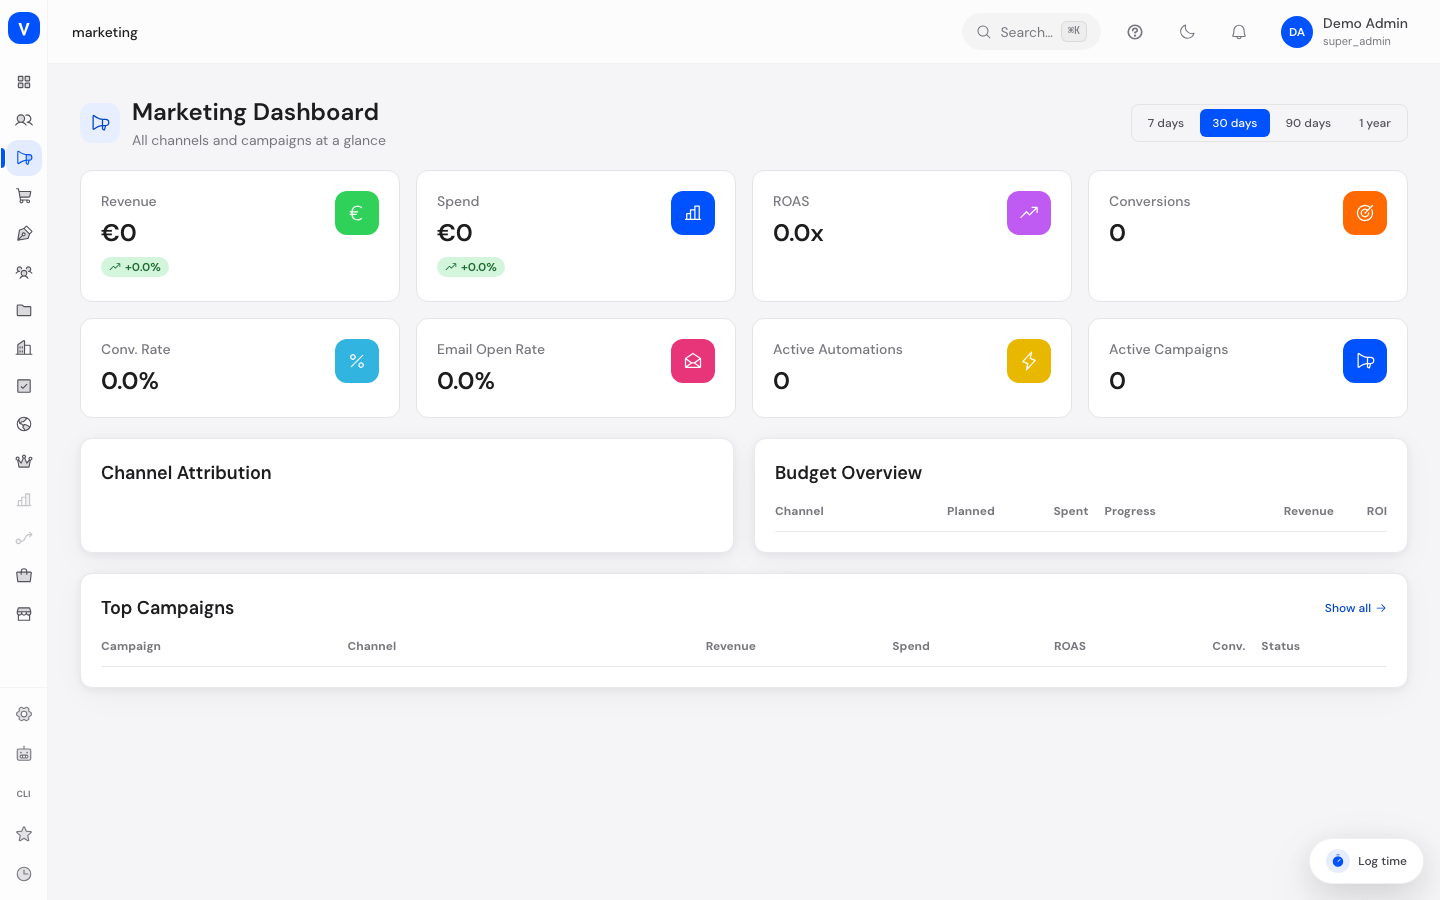
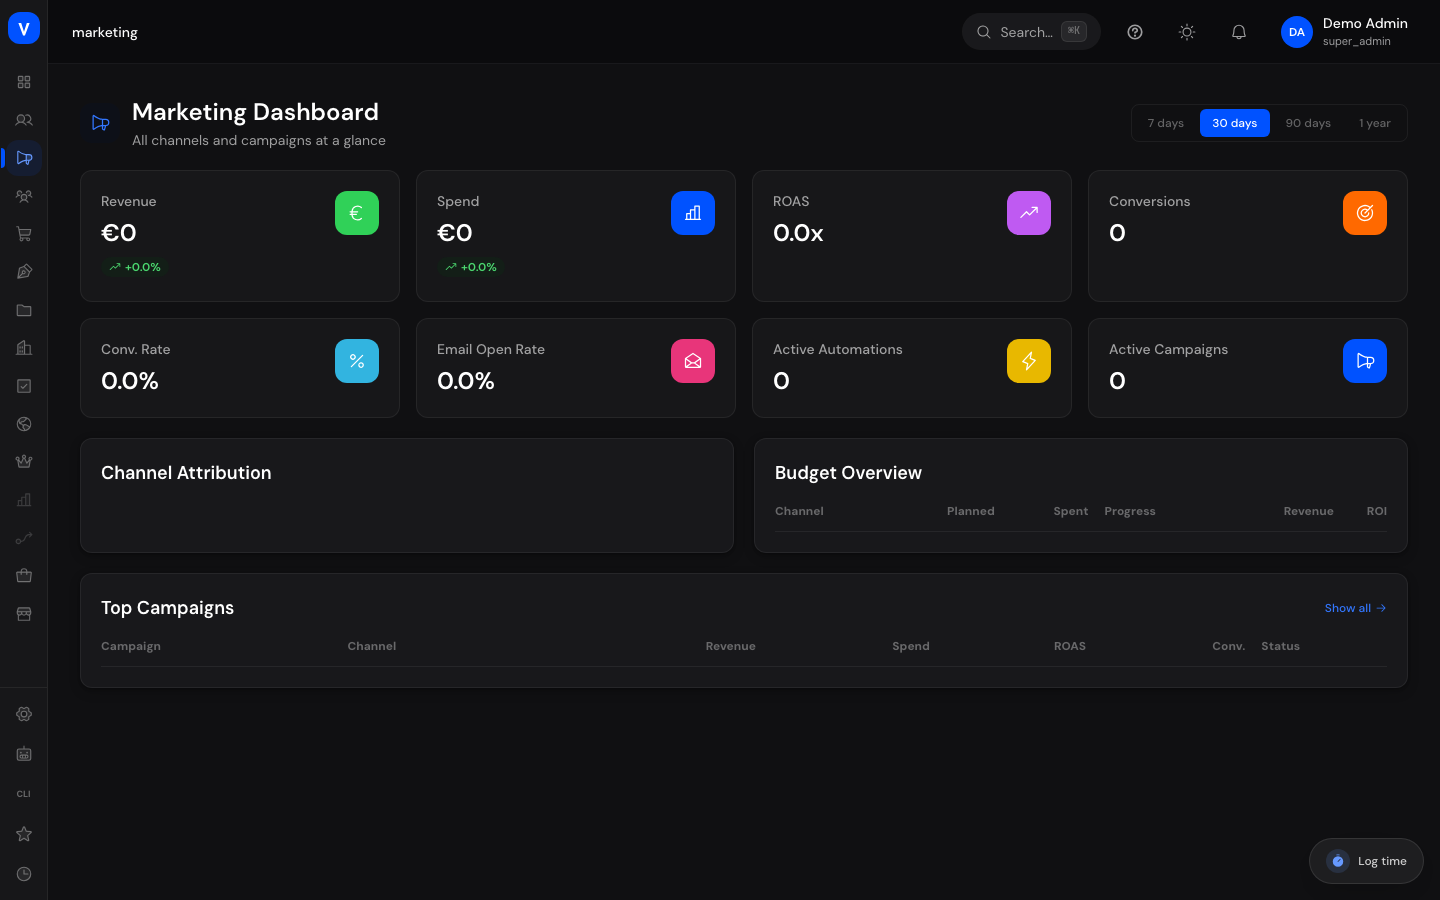
/marketingWhat can I do here?
- Choose the reporting period (7 days, 30 days, 90 days, or 1 year)
- See the key metrics (KPIs) for the selected period: revenue, spend, ROAS, conversions, conversion rate, email open rate, active automations, and active campaigns
- See how much revenue each marketing channel contributes (channel attribution)
- Review the budget overview per channel (planned vs. actually spent)
- View your top 10 campaigns by revenue and jump straight to the full campaign list
Step by step
- Choose the desired period in the top-right corner (7 days, 30 days, 90 days, or 1 year).
- Check the KPI tiles for the overall picture.
- In "Channel Attribution", check which channels (e.g. Google Ads, Social Media, Email) contribute the most revenue.
- In "Budget Overview", check whether a channel has already used up most of its budget.
- Click "Show all" next to "Top Campaigns" to switch to the full campaign overview.
Fields explained
| Field | Meaning | Notes/Effect |
|---|---|---|
| Revenue | Revenue attributable to marketing channels within the selected period | Basis for the ROAS calculation |
| Spend | Total advertising and marketing spend within the period | Broken down by channel in the Budget Overview |
| ROAS | Return on Ad Spend: revenue generated per euro spent | Higher is better |
| Conversions | Number of completed goal actions (e.g. orders) | Shown per campaign and channel |
| Conv. Rate | Share of visitors who completed a conversion | |
| Email Open Rate | Share of opened emails from your campaigns/newsletters | |
| Active Automations | Number of currently running marketing automations | See Automations |
| Active Campaigns | Number of currently running campaigns across all channels | |
| Channel | Source of the revenue (e.g. Organic, Google Ads, Social Media, Email) | |
| Share | Percentage revenue share of a channel in total revenue | |
| Planned / Spent | Planned budget of a channel vs. budget already used | Progress bar turns orange above 90% usage |
| ROI | Return on Investment of the channel budget |
Values & status
Campaign status (Top Campaigns table)
| Value | Meaning | What happens |
|---|---|---|
| Active | The campaign is currently running | Spend and results are tracked continuously |
| Paused | The campaign has been temporarily halted | No new spend accrues until it's resumed |
| Ended | The campaign has finished | No further spend or results are tracked |
| Sent | An email campaign has already been sent | Open and click rates are tracked afterwards |
| Draft | The campaign has been created but not started yet | No spend accrues yet |
Frequently asked questions
Where does the data in the dashboard come from?
It is combined from all marketing channels connected in SCS, for example ad accounts, social media accounts, email campaigns, and organic shop traffic.
Why do I see no data even though I've created campaigns?
Check whether the selected period covers your campaign's runtime, and whether the associated account (e.g. Google Ads) is connected under Integrations.
What does a high ROAS value mean?
A ROAS of, say, "5.0x" means: for every euro spent, 5 euros of revenue came back. The higher the value, the more cost-effective the spend.
How do I get from here to a specific campaign?
Click "Show all" in the "Top Campaigns" table to go to the full campaign overview.