Marketing Analytics
Marketing Analytics gives you deeper insight into your marketing channels: where revenue comes from, where visitors drop off, and how much a customer is worth over time.
/marketing/analyticsWhat can I do here?
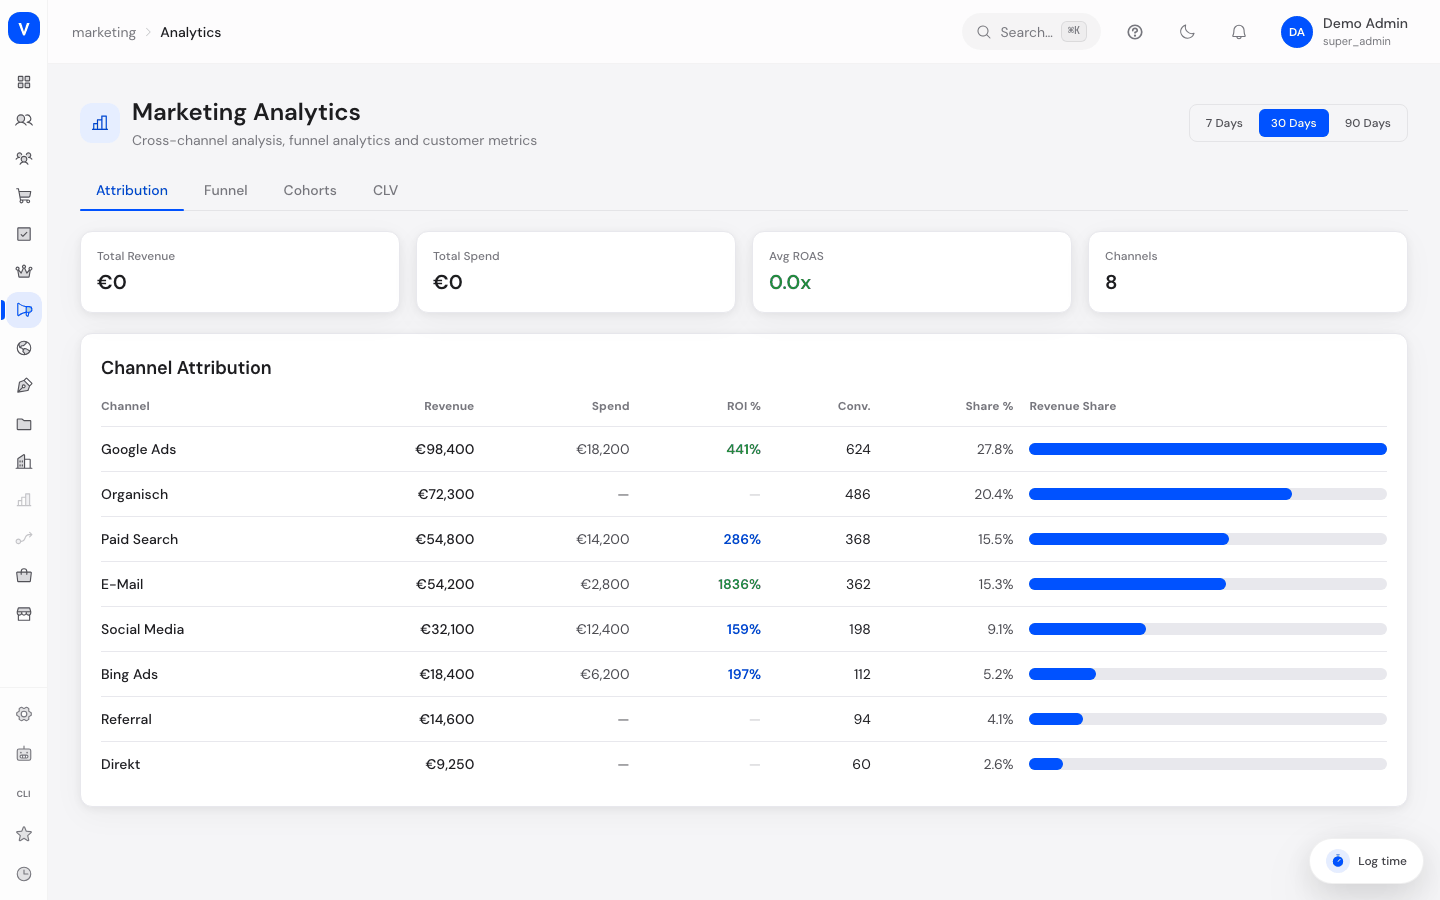
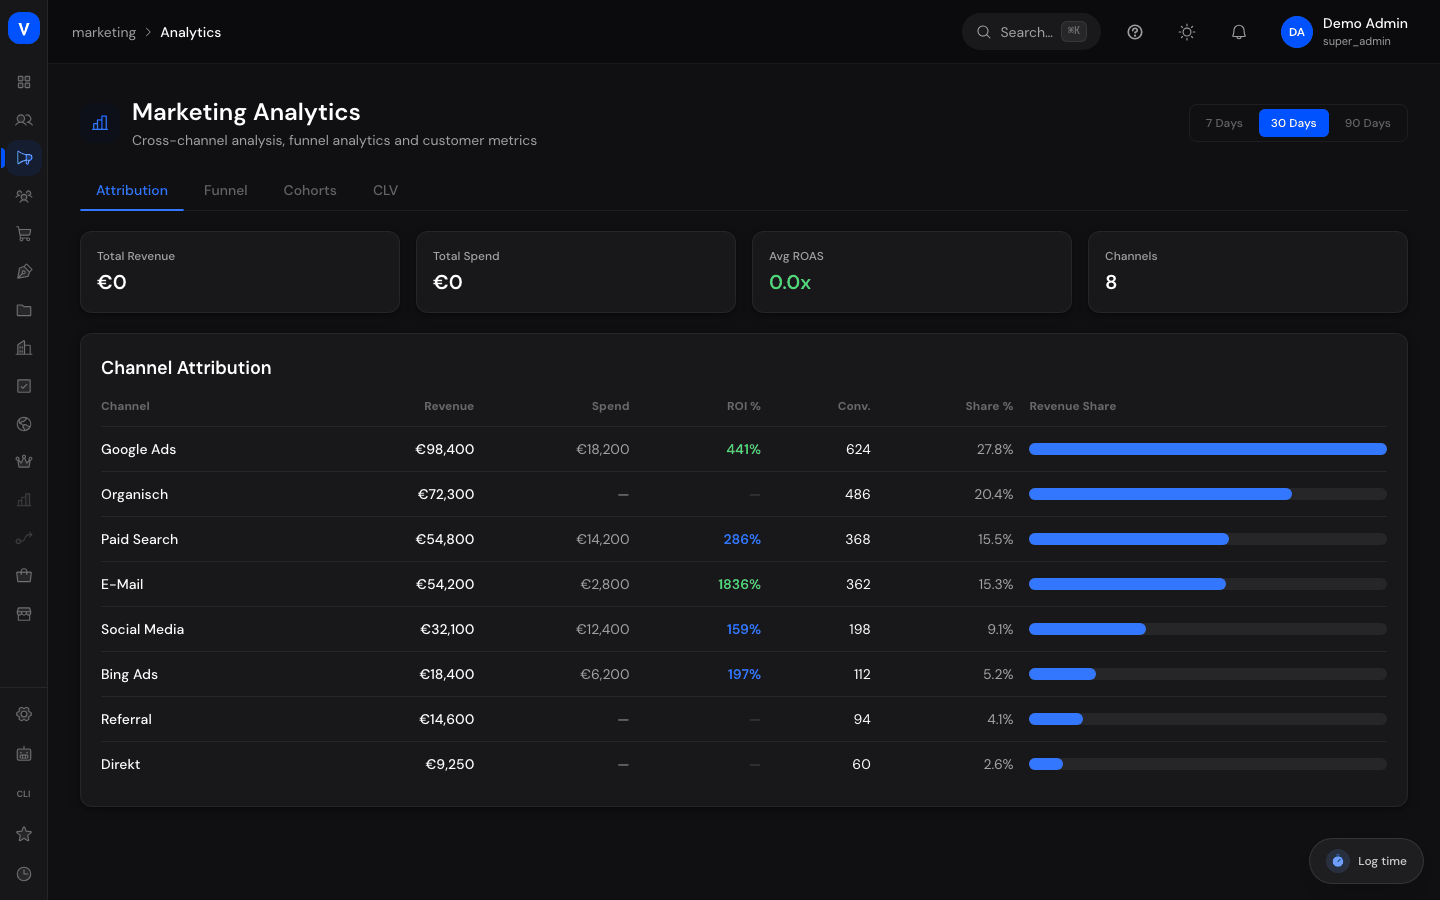
- In the "Attribution" view, see how much revenue, spend, and ROI each channel generates
- In the "Funnel" view, track how many visitors become leads, carts, and orders, and where the biggest drop-offs happen
- In the "Cohorts" view, compare customer retention by acquisition month across several following months
- In the "CLV" view, see the average Customer Lifetime Value per customer and per acquisition channel
Step by step
- Choose one of the four views at the top: Attribution, Funnel, Cohorts, or CLV.
- In "Attribution" you can also choose the period (7/30/90 days) to filter the channel table.
- Sort the attribution table by revenue to identify your strongest channels.
- In "Funnel", check the drop-off rate between the stages visitors → leads → carts → orders.
- In "Cohorts", compare which acquisition month shows the best customer retention after 1 or 3 months.
Fields explained
| Field | Meaning | Notes/Effect |
|---|---|---|
| Channel | Marketing channel that revenue was attributed to (e.g. Organic, Google Ads, Social Media, Email, Bing Ads, Referral, Direct, Paid Search) | |
| Revenue | Revenue attributed to the channel within the selected period | |
| Spend | Spend for the channel within the selected period | Usually €0 for organic/direct channels |
| ROI % | Percentage return on investment ((Revenue − Spend) / Spend) | Only calculable if spend > 0 |
| Conv. | Number of conversions attributed to the channel | |
| Share % | Channel's share of total revenue | |
| Revenue Share (bar) | Visual comparison of channels by revenue | |
| Visitors/Leads/Carts/Orders | The four stages of the conversion funnel | Each stage shows count, share of stage 1, and drop-off vs. the previous stage |
| Cohort | Month in which customers were first acquired | |
| Customers (cohort) | Number of customers first acquired in that month | |
| Month 0–6 | Retention (in %) of the cohort in the following months after first acquisition | Empty cell = not enough time has passed yet |
| Avg CLV | Average Customer Lifetime Value across all customers | |
| CLV by acquisition channel | Average CLV, customer count, and total revenue per channel through which a customer was acquired |
Frequently asked questions
What's the difference between the Marketing Dashboard and Marketing Analytics?
The Dashboard shows a compact daily overview. Marketing Analytics provides deeper analysis such as funnel analysis, cohorts, and Customer Lifetime Value.
What does "drop-off" mean in the funnel?
The share of visitors/leads/carts that did not reach the next stage of the purchase process.
Why is there no value for some cohort months?
Because not enough time has passed yet for that combination of acquisition month and following month to measure retention.
How is CLV calculated?
Customer Lifetime Value shows the average total revenue per customer, broken down by the channel through which the customer was originally acquired.